Gold price chart — gold chart live, price graph and XAUUSD
Gold price by weight
Gold price by year
Gold rate for the period
GOLDEN BULLS FOR PROFITABLE INVESTMENTS TODAY IN VIEW OF RISING PRICES
-
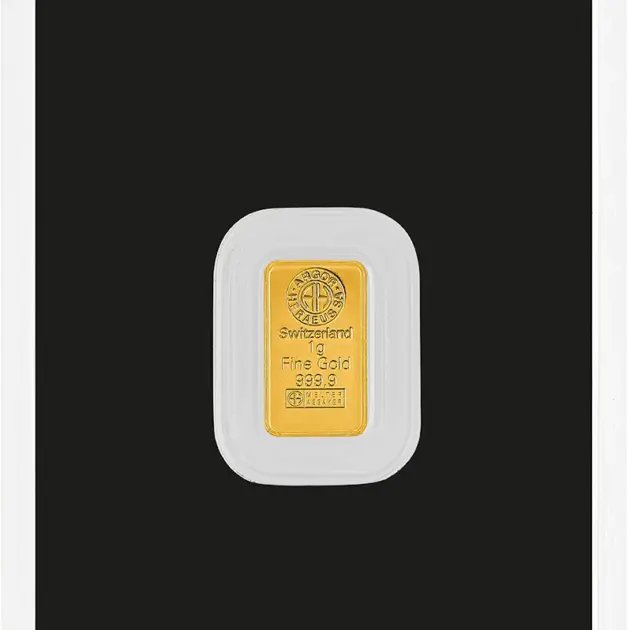
- Fine gold999.9
- Weight1 gram
- ProducerArgor-Heraeus
-
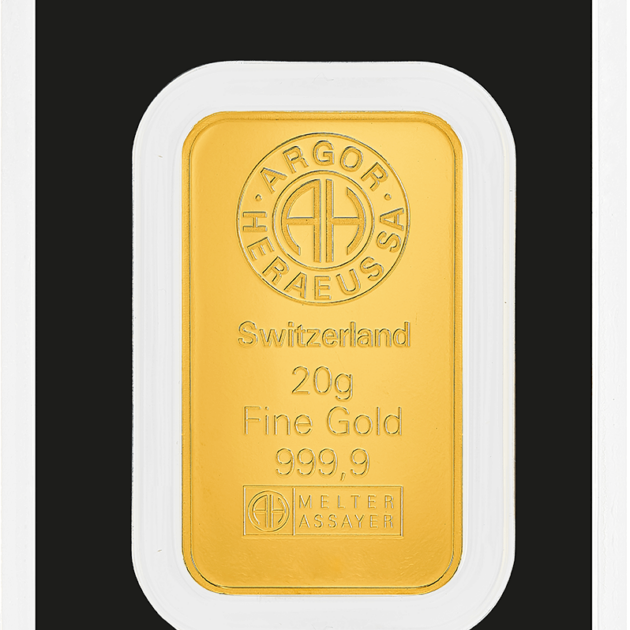
- Fine gold999.9
- Weight20 grams
- ProducerArgor-Heraeus
-
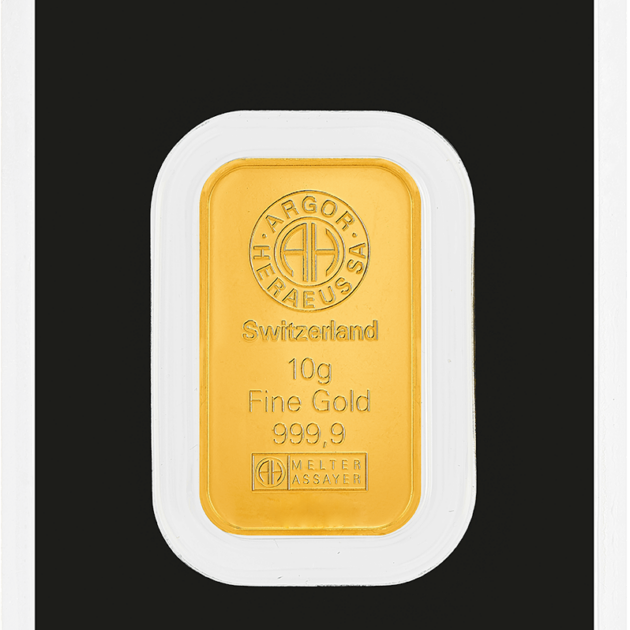
- Fine gold999.9
- Weight10 grams
- ProducerArgor-Heraeus
-
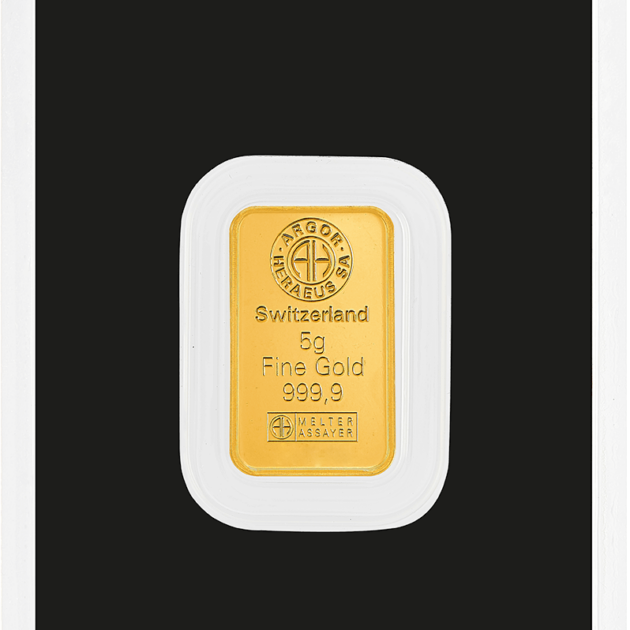
- Fine gold999.9
- Weight5 grams
- ProducerArgor-Heraeus
-
- Fine gold999.9
- Weight2 grams
- ProducerArgor-Heraeus
Gold is one of the few assets that investors watch every single day, and the easiest way to follow the market is through a gold price chart. A live chart shows how the price moves in real time and helps understand what is happening not only today, but also over months and years.
On this page you can see a gold chart live based on real market data. The price is displayed in both USD and CZK, which is important for investors in the Czech Republic. Gold is traded globally in US dollars, but the local value depends on the exchange rate, so the price in Czech crowns may move differently even when the global chart looks stable.
The chart is built on the spot gold price — the real market value used on international exchanges. This is the same price that determines the cost of bars, coins, and investment gold around the world. Because of this, the price you see here reflects the actual market, not an estimated or delayed value.
Historical data is also available, which allows you to look beyond short-term movements. When you view the gold price chart over a longer period, clear trends appear. Gold often rises during crises, inflation, or economic uncertainty, which is why many investors follow the chart regularly to understand the direction of the market.
Current Gold Price Chart — How to Read the Quotes?
A gold price chart shows the spot price of gold — the current market value at which gold is traded on global exchanges. The main unit used worldwide is the troy ounce, equal to 31.1 grams. When you look at any professional gold chart, including the XAU/USD chart, the price you see is usually the value of one troy ounce in US dollars.
Gold charts can display prices in different units, such as ounces, grams, or kilograms, but the base value always comes from the ounce price. The chart on this page shows both USD and CZK, so investors can see the global price and the local value at the same time. This is especially useful in the Czech Republic, where the exchange rate between USD and CZK can significantly change the final price.
The XAUUSD chart is the standard way to track the global gold price. XAU is the international symbol for gold, and USD means the price is quoted in US dollars. When the XAUUSD rate moves, it affects gold prices all over the world, including the price shown in CZK.
To read the chart correctly, look at the horizontal axis for time and the vertical axis for price. You can choose different time ranges, from one day to many years. Investors watch these charts because they show trends, volatility, and key moments when the market changes direction.
Gold Price History — Key Milestones
The gold history shows that the market moves in cycles. Prices do not rise all the time, but over long periods gold often keeps its value and grows during uncertain economic conditions. When you look at the graph over many years, several important milestones become clear.
- 2008 financial crisis — strong rise in gold price
During the global financial crisis investors moved money into safe assets, and gold demand increased sharply. This caused the gold price chart to climb as markets searched for stability. - 2011 record high after the crisis
Continued economic uncertainty and low interest rates pushed gold to one of the highest levels in history. This period is still one of the most important points on any gold price history chart. - 2020 COVID-19 pandemic peak
The pandemic created global uncertainty, and central banks lowered rates while printing money. As a result, gold reached another major high, which is clearly visible on the gold price chart last 10 years. - 2024–2025 new highs in the market
High inflation, geopolitical tensions, and strong central-bank demand pushed gold to new historical levels. These recent peaks confirm that gold remains a key defensive asset in modern markets. - Long-term trend — inflation, rates, and USD matter most
Over time, the gold price graph is strongly affected by inflation, interest rates, and the strength of the US dollar. When rates fall or uncertainty grows, gold usually rises, which is why long-term charts are more important than short-term movements.
Gold Price in CZK — Live Chart
Gold is traded globally in US dollars, which means the base price of gold is always calculated in USD. However, investors in the Czech Republic usually buy gold in Czech crowns, so the local price depends not only on the gold market but also on the USD/CZK exchange rate. Because of this, the CZK gold price chart may move differently from the global USD chart even when the spot price stays the same.
This is why it is important to watch both values at the same time. When the dollar becomes stronger, the price of gold in CZK can rise even if the international market is stable. When the dollar weakens, the opposite can happen. The exchange rate effect is one of the main reasons why Czech investors follow the CZK chart instead of looking only at the global price.
On this page you can see the gold price in CZK and USD together, which makes it easier to understand the real value of gold in the local market. This allows you to track the gold price now and see how currency changes affect the final cost of investment gold, coins, or bars in the Czech Republic.
For long-term investors this difference matters a lot. A chart in USD shows the global trend, but the CZK chart shows the real result for local buyers. That is why professional investors often monitor both charts to understand the full picture of the market.
Live Gold Price Chart — Real-Time Data
The live gold chart is based on the spot price of gold, which is the current market value at which gold is traded on international exchanges. This price is constantly updated during trading hours and reflects real supply and demand. Because the gold market is global, the chart can change every second.
Exchanges and financial markets determine the price of gold using the troy ounce as the standard unit. The gold USD chart shows the value of one ounce in dollars, and all other prices — grams, kilograms, or local currencies — are calculated from this base value.
It is important to understand the difference between spot price and retail price. The spot price shown on the USD chart is the pure market value, while the final price for coins or bars may include dealer premiums, taxes, or delivery costs. The chart shows the real market, not the final shop price.
Real-time charts are used by traders, investors, and analysts to follow market movements and react quickly to changes. By watching the live gold chart, you can see how news, interest rates, inflation, or currency moves affect the price almost instantly.
Track live chart data on DealFin.cz and follow the market in real time. Interactive live chart shows current quotes in USD and CZK, full history, and long-term trends.
DealFin is your reliable source for accurate CZK price and global gold market data.