Gold Price Chart – 5 Years of Price Development
Over the past 5 years, a great deal has happened in the gold market. The development was not calm; rather, it was a period of many fluctuations, high volatility, and above all, significant growth in the price of this precious metal.
On this page, you will therefore find not only a chart of gold price development over the last 5 years, but also an analysis and key events that have taken place in recent years and influenced the price.
Gold Price Chart – 5 Years of Development in One Place
Gold price by weight
Gold price by year
Gold rate for the period
GOLDEN BULLS FOR PROFITABLE INVESTMENTS TODAY IN VIEW OF RISING PRICES
-
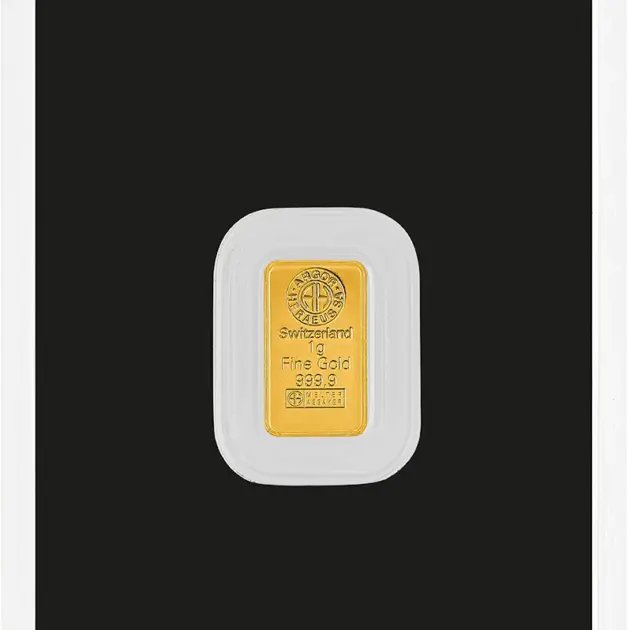
- Fine gold999.9
- Weight1 gram
- ProducerArgor-Heraeus
-
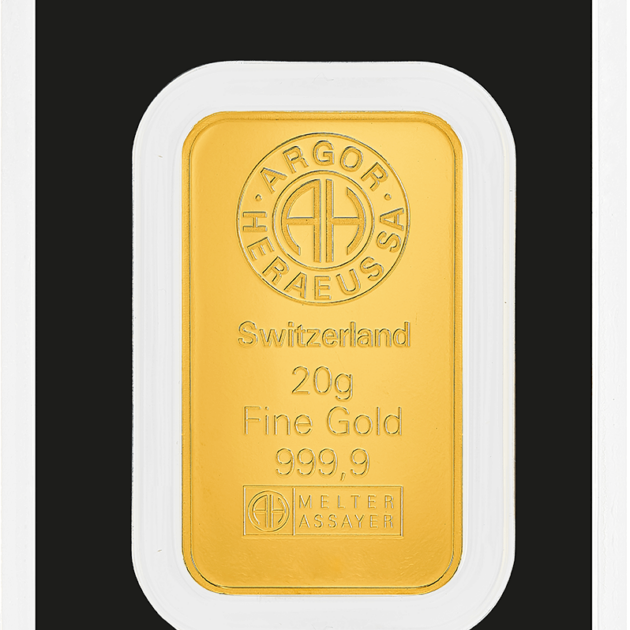
- Fine gold999.9
- Weight20 grams
- ProducerArgor-Heraeus
-
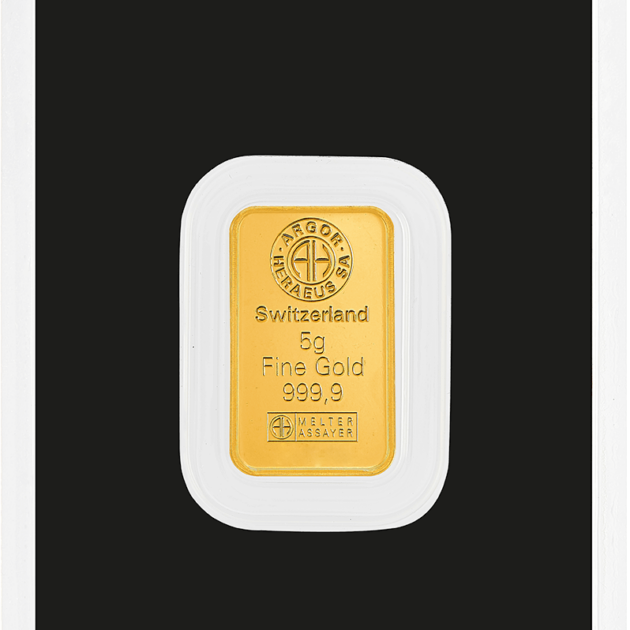
- Fine gold999.9
- Weight5 grams
- ProducerArgor-Heraeus
-
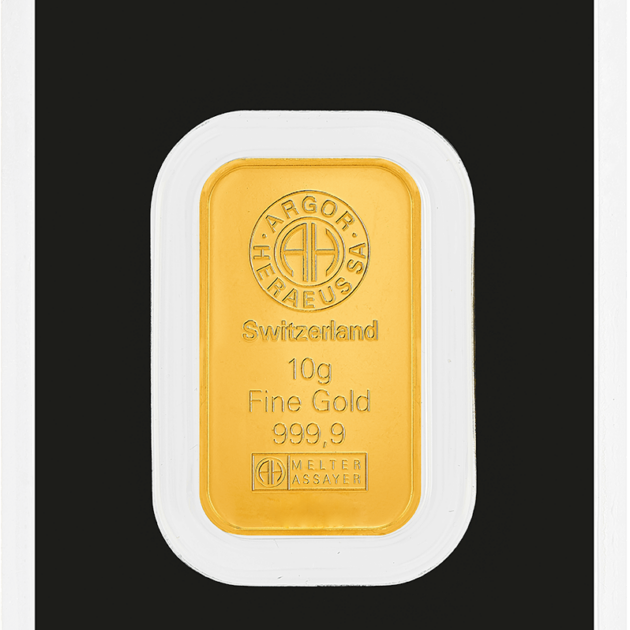
- Fine gold999.9
- Weight10 grams
- ProducerArgor-Heraeus
-
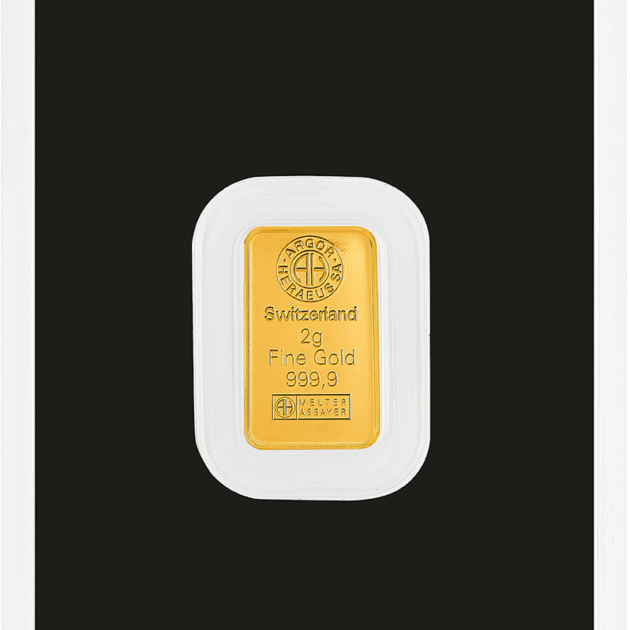
- Fine gold999.9
- Weight2 grams
- ProducerArgor-Heraeus
The gold price chart over 5 years presents the development of the value of this precious metal over the past period. At first glance, a strong upward trend is evident, starting just below 2,000 USD per troy ounce and ending at today’s levels of around 4,400 USD per ounce. Over this period, gold has recorded a value increase of approximately 155%.
Let us now briefly describe the key events that had the greatest impact on gold price development over the past 5 years:
- Inflation and interest rates (2021–2022): The rise in global inflation increased interest in gold, although aggressive interest rate hikes by the US Federal Reserve initially strongly suppressed this trend.
- Invasion of Ukraine (2022): The outbreak of war caused a massive geopolitical shock, leading to a shift of capital into safe assets and a sharp rise in gold prices above 2,000 USD.
Banking crisis (2023): The collapse of institutions such as Silicon Valley Bank and the fall of Credit Suisse triggered fears about the stability of the financial system and sharply increased demand. - Middle East conflict (2023–2024): The geopolitical premium of gold increased significantly after the escalation of tensions in Gaza, as investors sought protection from regional instability.
- Central bank purchases (2022–2025): Countries such as China began to accumulate gold reserves long-term to reduce dependence on the US dollar, creating strong support for sustained price growth. Other central banks, including the Czech National Bank, also increased their gold reserves.
- Federal Reserve rate cuts (2024–2025): The subsequent easing of monetary policy and real interest rate reductions lowered the cost of holding gold, which gradually propelled the metal to all-time highs above 5,000 USD.
Now let us take a closer look at each of these events within the five-year history.
Key Events on the Gold Chart – 5-Year History
2021–2022: Inflation and interest rates
In 2021 and 2022, the world faced massive inflation, driven by strong post-pandemic recovery and disrupted global supply chains. Gold initially benefited significantly from its long-standing reputation as a hedge against currency devaluation.
However, the US Federal Reserve responded with unprecedented rapid interest rate increases. Rising government bond yields and a stronger dollar temporarily, but significantly, reduced the attractiveness of gold as a non-yielding asset.
2022: Invasion of Ukraine
The Russian aggression against Ukraine in February 2022 caused a major geopolitical shock in the markets. Fear of rapid conflict expansion and uncertainty regarding strategic energy supplies triggered widespread panic among investors.
Gold acted as a traditional safe haven during this period. Capital quickly moved into safer assets, immediately pushing the price above 2,000 USD.
2023: Banking crisis
In spring 2023, financial markets were shaken by unexpected collapses of US regional banks, especially Silicon Valley Bank. The situation worsened with the subsequent collapse and forced takeover of the European giant Credit Suisse.
These unpredictable events raised serious concerns about the overall stability of the global financial system, prompting investors to seek protection outside the traditional banking sector. This triggered another strong wave of physical gold purchases.
2023–2024: Conflict between Israel and Hamas
October 2023 brought an unexpected escalation of military tensions in the Middle East. This significantly increased the long-term geopolitical premium of gold. The threat of a broader regional conflict forced markets to reassess risks rapidly.
Gold responded with strong growth despite record-high interest rates at the time. Investors viewed the metal as an essential safeguard against unpredictable military and political developments in a strategically important region.
2022–2026: Central bank purchases
A key structural factor in recent years has been record gold purchases by global central banks. China led this strategy, followed closely by other major emerging economies.
The main motivation behind these actions was the diversification of foreign exchange reserves and a reduction in dependence on the US dollar. This persistent institutional demand created strong support against potential price declines.
2024–2025: Federal Reserve rate cuts
After inflation was brought under control, the US central bank (the Fed) began easing monetary policy.
Lower interest rates significantly reduced the opportunity cost of holding gold. Cheaper money and a weaker dollar provided the strongest final impulse, pushing gold prices to all-time highs around 4,500 USD and keeping them elevated for an extended period.
Trend Analysis and Conclusions for Investors
Over the past 5 years, gold has delivered an annual return of approximately 15–20%. The total return exceeded around 155%. It is currently one of the fastest-growing assets in financial markets over this period.
For comparison, here are returns of other assets over the last 5 years (March 24, 2021 – March 24, 2026):
- Silver: 185%
- S&P 500 Index: 98%
- Dow Jones Industrial Average Index: 43%
- EURO STOXX 50 Index: 43%
- Bitcoin: 28.7%
- Ethereum: 28%